Fundamentals of Statistical Tests
Population and Sample (George W. Snedecor & William G. Cochran, 1989)
- Population is the entire set of elements of the study.
- The list of all the elements or individuals of the study is called as frame.
- Study of all elements of a population is called census.
- If we select only a subset of the population is called sample.
Parameter and Statistic
- Descriptive measures calculated from the entire population are called parameters, where as measures that are calculated from a sample data are called statistics.
Standard deviation
- The standard deviation is a measure of the amount of variation or dispersion in a set of values.
- The standard deviation (SD) is defined as the square root of the average of the squared deviations from the mean.
- This statistical measure quantifies the dispersion or variability of a set of data points relative to their mean (average) value. In essence, it reflects how much individual data points differ from the mean of the dataset.
- A low standard deviation means that the values tend to be close to the mean (also called the expected value) of the set, while a high standard deviation means that the values are spread out over a wider range.
Standard deviation of population:
The formula for the standard deviation of a population (\(s\)) is:
\[ \sigma = \sqrt{\frac{1}{n} \sum_{i=1}^{n} (x_i - \mu)^2} \]
where:
- \(\sigma\) is the population standard deviation,
- \(n\) is the size of the population,
- \(x_i\) is each individual observation,
- \(\mu\) is the population mean,
- \(\sum_{i=1}^{n}\) denotes the sum over all observations in the population.
Standard deviation of sample:
The formula for the standard deviation of a sample (\(s\)) is:
\[ s = \sqrt{\frac{1}{n-1} \sum_{i=1}^{n} (x_i - \bar{x})^2} \]
where:
- \(s\) is the sample standard deviation,
- \(n\) is the number of observations in the sample,
- \(x_i\) is each individual observation,
- \(\bar{x}\) is the sample mean,
- \(\sum_{i=1}^{n}\) denotes the sum over all observations.
The formula for the sample standard deviation (\(\sigma\)) is similar but divides by \(n-1\) instead of \(n\):
The divisor \(n-1\) in the sample standard deviation formula accounts for the degrees of freedom in the estimation of the standard deviation and corrects the bias in the estimation of the population standard deviation from a sample. This correction is known as Bessel’s correction.
Standard deviation calculation
Standard deviation calculation using Excel:
Standard deviation calculation using R:
Sample Standard Deviation
Population Standard Deviation
Standard deviation calculation using python:
Sample Standard Deviation
Population Standard Deviation
Example dataset:
download the dataset here
Calculate Standard Deviation of credit score with R
Code
R
library(readxl)
# laod data and View
data_bank <- read_excel("Bank Customer Churn Prediction.xlsx")
data_bank
sample_size <- length(data_bank$credit_score)
sample_size
# Calculate sample mean
sample_mean <- mean(data_bank$credit_score)
sample_mean
# Calculate sample standard deviation
sample_sd <- sd(data_bank$credit_score)
sample_sd
# Calculate population standard deviation
population_sd <- sqrt(sum((data_bank$credit_score - sample_mean)^2) / (sample_size))
population_sd
Calculate Standard Deviation of credit score with Python
To load excel data into python, install openpyxl in jupyter notebook using the command !pip3 install pandas openpyxl
Code
python
import pandas as pd
import numpy as np
# Load data
data_bank = pd.read_excel("Bank Customer Churn Prediction.xlsx")
data_bank

# Calculate sample mean of credit score
sample_mean = np.mean(data_bank['credit_score'])
sample_mean

# Calculate sample standard deviation of credit score
sample_sd = np.std(data_bank['credit_score'], ddof=1)
sample_sd

# Calculate population standard deviation of credit score
population_sd = np.std(data_bank['credit_score'], ddof=0)
population_sd
:::
Hypothesis Testing
Hypothesis testing is a statistical method used to make decisions about a population based on sample data. It’s a core concept in statistics and research, allowing scientists, analysts, and decision-makers to test assumptions, theories, or hypotheses about a parameter (e.g., mean, proportion) of a population.
Fundamental Concepts of Hypothesis testing
Hypotheses: In hypothesis testing, two opposing hypotheses are formulated:
- Null Hypothesis (\(H_0\)): It assumes no effect or no difference in the population. It’s a statement of “no change” or “status quo.”
- Alternative Hypothesis (\(H_a\) or \(H_1\)): It represents what the researcher aims to prove. It suggests a new effect, difference, or change from the status quo.
Significance Level (\(\alpha\)): It’s the threshold for rejecting the null hypothesis, typically set at 0.05 (5%). It represents the probability of rejecting the null hypothesis when it’s actually true, known as Type I error.
P-value: The probability of observing the sample data, or something more extreme, if the null hypothesis is true. A small p-value (typically ≤ 0.05) indicates strong evidence against the null hypothesis.
Test Statistic: A value calculated from the sample data, used to evaluate the likelihood of the null hypothesis. The form of the test statistic depends on the test type (e.g., z-test, t-test).
Steps in Hypothesis Testing
Formulate Hypotheses: Define the null and alternative hypotheses based on the research question.
Choose the Significance Level: Set the \(\alpha\) level (e.g., 0.05).
Select the Appropriate Test: Based on the data type and hypothesis, choose a statistical test (e.g., t-test for comparing means).
Calculate the Test Statistic: Use the sample data to compute the test statistic.
Determine the P-value: Find the probability of observing the test results under the null hypothesis.
Make a Decision: Compare the p-value to \(\alpha\). If the p-value is less than \(\alpha\), reject the null hypothesis; otherwise, fail to reject it.
Errors in Hypothesis Testing
- Type I Error(False Positive): Rejecting the null hypothesis when it is true.
- Type II Error(False Negative): Failing to reject the null hypothesis when the alternative hypothesis is true.
Basic Types of Tests
- Z-test: Used for hypothesis testing when the population variance is known and the sample size is large.
- T-test: Applied when the population variance is unknown. It includes one-sample, independent two-sample, and paired t-tests.
- ANOVA (Analysis of Variance): Used to compare the means of three or more samples.
- Chi-square Test: Applied to categorical data to assess how likely it is that an observed distribution is due to chance.
- Regression Analysis: Tests hypotheses about relationships between variables.
Power of the Test
- The power of a hypothesis test is the probability that it correctly rejects a false null hypothesis (1 - Probability of Type II error). High power is desirable and can be increased by enlarging the sample size, increasing the effect size, or choosing a higher significance level.
Assumptions of the Test
Most statistical tests have underlying assumptions about the data (e.g., normality, independence, homoscedasticity). Violating these assumptions can affect the validity of the test results.
- It’s important to choose the right test based on these assumptions or use non-parametric tests that don’t rely on such assumptions.
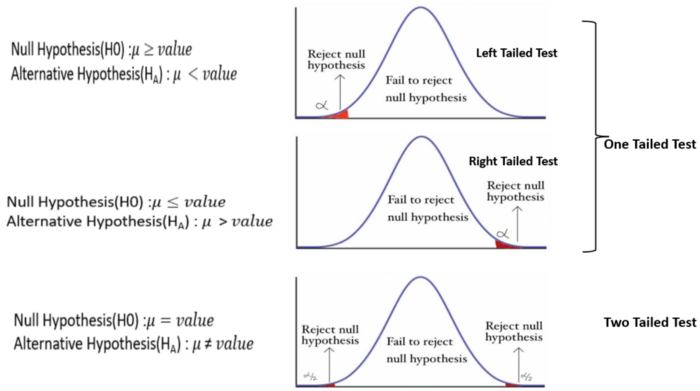
One-tailed vs. Two-tailed Tests
A hypothesis test can be one-tailed or two-tailed, depending on the nature of the alternative hypothesis.
One-tailed and two-tailed tests are two approaches to statistical hypothesis testing that are used to determine if there is enough evidence to reject the null hypothesis, considering the directionality of the relationships or differences.
One-tailed Tests
A one-tailed test, also known as a directional test, is used when the research hypothesis specifies the direction of the relationship or difference. It tests for the possibility of the relationship in one specific direction and ignores the possibility of a relationship in the other direction. This makes a one-tailed test more powerful than a two-tailed test for detecting an effect in one direction because all the statistical power of the test is focused on detecting an effect in that one direction.
When to use: - If you have a specific hypothesis that states one variable is greater than or less than the other variable. - If the consequences of missing an effect in one direction are not as critical as in the other direction.
Example: Suppose you are testing a new drug and believe that it will be more effective than the current treatment. You would use a one-tailed test to determine if the new drug is significantly better.
Two-tailed Tests
A two-tailed test, or a non-directional test, is used when the research hypothesis does not specify the direction of the expected relationship or difference. It tests for the possibility of the relationship in both directions. This means that it checks for both, whether one variable is either greater than or less than the other variable, thus requiring more evidence to reject the null hypothesis compared to the one-tailed test.
When to use: - If you do not have a specific direction in mind or if you are interested in detecting any significant difference, regardless of the direction. - If the consequences of missing an effect are equally important in both directions.
Example: Suppose you are testing a new teaching method and want to find out if it has a different effect (either better or worse) on students’ test scores compared to the traditional method. A two-tailed test would be appropriate in this case.
Choosing Between One-tailed and Two-tailed Tests
The choice between a one-tailed and two-tailed test should be determined by the research question or hypothesis. One-tailed tests are more powerful for detecting an effect in one direction but at the cost of potentially missing an effect in the other direction. Two-tailed tests are more conservative and are used when it is important to detect effects in either direction.
Considerations:
- Research Hypothesis: The directionality of your hypothesis should guide your choice.
- Potential Biases: Be cautious of choosing a one-tailed test for the mere purpose of achieving statistical significance. This practice can lead to biases in research.
- Field of Study: Some fields have conventions preferring one type of test over the other, often based on the typical research questions and hypotheses in those fields.
Summary
| Concept | Description |
|---|---|
| Standard deviation | |
| Standard deviation | The standard deviation is a measure of the amount of variation or dispersion in a set of values |
| Standard deviation calculation | |
| Standard deviation calculation using **Excel**: | link here |
| Standard deviation calculation using **R**: | Sample Standard Deviation** |
| Standard deviation calculation using **python**: | Sample Standard Deviation** |
| Calculate Standard Deviation of credit score with R | Key concept under Standard deviation calculation |
| Calculate Standard Deviation of credit score with Python | To load excel data into python, install openpyxl in jupyter notebook using the command !pip3 install pandas openpyxl** |
| Hypothesis Testing | |
| Fundamental Concepts of Hypothesis testing | Hypotheses:** In hypothesis testing, two opposing hypotheses are formulated: Null Hypothesis (**$H_0$): It assumes no effect or no difference in the population |
| Steps in Hypothesis Testing | Formulate Hypotheses**: Define the null and alternative hypotheses based on the research question |
| Errors in Hypothesis Testing | Type I Error(False Positive)**: Rejecting the null hypothesis when it is true |
| Basic Types of Tests | Z-test**: Used for hypothesis testing when the population variance is known and the sample size is large |
| Power of the Test | The power of a hypothesis test is the probability that it correctly rejects a false null hypothesis (1 - Probability of Type II error) |
| Assumptions of the Test | Most statistical tests have underlying assumptions about the data (e.g., normality, independence, homoscedasticity) |
| One-tailed vs. Two-tailed Tests | |
| One-tailed Tests | A one-tailed test, also known as a directional test, is used when the research hypothesis specifies the direction of the relationship or difference |
| Two-tailed Tests | A two-tailed test, or a non-directional test, is used when the research hypothesis does not specify the direction of the expected relationship or difference |
| Choosing Between One-tailed and Two-tailed Tests | The choice between a one-tailed and two-tailed test should be determined by the research question or hypothesis |