Code
# Install required packages if not already installed
install.packages("tidyverse")
An algorithm is a set of defined instructions or rules designed to solve a specific problem or perform a computation.
In the context of analytics, intelligence, and machine learning, algorithms form the backbone of data-driven processes, enabling machines to learn patterns, make decisions, and optimize outcomes (Konstantinos G. Liakos et al., 2018). Algorithms are implemented using programming languages and work on data to provide actionable insights.
Algorithm Explanation: Linear regression finds the relationship between an independent variable X and a dependent variable Y by fitting a line that minimizes the sum of squared differences between observed and predicted values.
Dataset: Use the built-in mtcars dataset in R.
# Install required packages if not already installed
install.packages("tidyverse")Big Data refers to massive, complex, and high-velocity datasets that traditional data processing systems are unable to handle effectively. These datasets are characterized by their vast size and require advanced tools, algorithms, and storage mechanisms for processing and analysis. Big Data plays a transformative role in analytics, intelligence, and machine learning by enabling insights that were previously unattainable.
Data Analytics is the process of examining, cleaning, transforming, and modeling data with the objective of discovering useful information, informing conclusions, and supporting decision-making. - It’s a multifaceted field that combines theories and techniques from different disciplines like mathematics, statistics, computer science, and information technology.
Business analytics can be divided into several types, each addressing different kinds of decision-making needs and business processes. Here are the primary types of business analytics:

Types of Business Analytics
| Type | Description | Key Features | Examples |
|---|---|---|---|
| Descriptive | Focuses on describing or summarizing past data to understand what has happened in the business. | - Uses data aggregation and data mining techniques. - Provides insights into past performance. |
- Sales reports - Customer churn rates |
| Diagnostic | Examines past performance to determine the causes of past success or failure. | - Involves data discovery, correlations, and drill-downs. - Answers “why did it happen?” |
- Root cause analysis - Performance discrepancies analysis |
| Predictive | Uses statistical models and forecasts techniques to understand the future. | - Employs statistical algorithms and machine learning. - Predicts future trends and outcomes. |
- Market trends forecasting - Demand prediction |
| Prescriptive | Suggests actions you can take to affect desired outcomes. | - Combines insights from all other analytics. - Recommends decisions using optimization and simulation algorithms. |
- Supply chain optimization - Dynamic pricing strategies |
| Cognitive | Mimics human brain function to improve decision-making. | - Utilizes artificial intelligence and machine learning. - Enhances human decision-making with insights from data analysis and pattern recognition. |
- Chatbots for customer service - Personalized marketing |
Descriptive analytics is the examination of historical data to understand changes that have occurred in a business.
By analyzing past events and performances, descriptive analytics helps organizations understand the reasons behind success or failure, identify trends, and make informed decisions. It is often considered the first step in the broader field of business analytics, laying the groundwork for more advanced predictive and prescriptive analysis.
Data Aggregation and Summarization: Gathering and consolidating data from various sources to provide a coherent overview. This includes compiling reports, dashboards, and visualizations that represent complex datasets in an accessible format.
Data Mining: Exploring large datasets to find patterns, correlations, and insights. This involves techniques such as clustering, classification, and association analysis to uncover hidden patterns in data.
Trend Analysis: Identifying consistent patterns or trends over time. This can involve moving averages, time-series analysis, and seasonal decomposition to understand temporal changes and cyclic patterns.
Visualization: Presenting data in graphical formats, such as charts, graphs, and heat maps, to help stakeholders quickly grasp the insights contained in the data. Effective visualization is crucial for communicating findings and supporting decision-making processes.
Descriptive analytics finds applications across all sectors of business, helping organizations to measure, track, and optimize their operations and strategies. Here are some key applications:
Performance Metrics and Benchmarking: Businesses use descriptive analytics to track performance metrics such as sales revenue, customer acquisition costs, and operational efficiency. By comparing these metrics against industry benchmarks, companies can gauge their performance and identify areas for improvement.
Financial Analysis: Organizations employ descriptive analytics to manage their financial health by analyzing income statements, balance sheets, and cash flow statements. This analysis helps in understanding revenue streams, expenses, profitability, and liquidity positions.
Customer Behavior Analysis: By examining past purchasing behaviors, preferences, and interactions, companies can better understand their customers. This insight is critical for improving customer service, tailoring marketing strategies, and enhancing customer retention.
Inventory Management: Descriptive analytics aids in optimizing inventory levels by analyzing historical sales data, seasonality, and trends. This enables businesses to reduce carrying costs, minimize stockouts, and improve order fulfillment.
Supply Chain Management: Analyzing historical data related to supply chain operations helps businesses identify bottlenecks, evaluate supplier performance, and optimize logistics. This leads to more efficient supply chain operations and cost reductions.
Diagnostic analytics takes a step further from descriptive analytics by not just describing what has happened in the past, but also attempting to understand why it happened.
It involves drilling down into your data, discovering patterns, identifying anomalies, and investigating the causes behind observed events or behaviors. Diagnostic analytics is essentially about finding relationships among data points and determining the factors that contribute to a particular outcome.
The process typically involves the following steps:
Data Collection and Preparation: Gathering comprehensive data from various sources and ensuring it’s cleaned and formatted for analysis.
Identification of Anomalies: Using techniques to identify deviations from the norm, which could indicate issues or opportunities for further investigation.
Drill-Down Analysis: Delving deeper into data to explore the factors that contributed to the anomalies or trends. This could involve segmenting the data or looking at it from different perspectives.
Hypothesis Testing: Formulating hypotheses about what might be causing the trends or issues and testing these hypotheses through statistical methods.
Root Cause Analysis (RCA): Employing various RCA techniques to pinpoint the underlying causes of observed phenomena.
Marketers use diagnostic analytics to understand the factors driving campaign performance. By analyzing customer behaviors, purchase patterns, and engagement metrics, companies can identify what elements of their campaigns are most effective and why certain strategies did not perform as expected.
In finance, diagnostic analytics can help identify the causes of budget variances or financial anomalies. For instance, if a company’s operational costs have significantly increased, diagnostic analytics can be used to drill down into various cost centers and uncover specific factors contributing to the increase.
Operations managers can use diagnostic analytics to improve process efficiencies and reduce waste. By examining production data, companies can find bottlenecks or inefficiencies in their manufacturing processes and understand the underlying reasons for operational delays or quality issues.
Healthcare providers utilize diagnostic analytics to improve patient care outcomes. By analyzing patient data, medical professionals can identify patterns related to adverse events, understand factors contributing to patient readmissions, and develop strategies to improve patient care.
Predictive analytics encompasses a suite of statistical techniques and models that analyze historical and current data to make predictions about future events or behaviors.
This branch of analytics is fundamentally about forecasting and is instrumental in various sectors for identifying trends, understanding customer behavior, managing risks, and optimizing operational processes. It leverages techniques from data mining, statistics, modeling, machine learning, and artificial intelligence to analyze and interpret data, thereby forecasting future probabilities with an acceptable level of reliability.
Data Collection: The foundation of any predictive analytics effort is data. This can include historical data, real-time data streams, structured data (like sales figures), and unstructured data (like social media posts).
Data Analysis: Before predictive modeling, data needs to be cleaned and analyzed to identify patterns, trends, and anomalies. This stage often involves exploratory data analysis (EDA) and data visualization.
Statistical Modeling: Predictive analytics uses various statistical models depending on the nature of the prediction and the data. Common models include regression analysis (linear and logistic regression), time series analysis, and complex algorithms like neural networks.
Machine Learning: Many predictive analytics applications utilize machine learning algorithms to process large datasets and improve predictions over time as more data becomes available. Algorithms can range from simple decision trees to complex deep learning models.
Validation: Models are validated using techniques such as cross-validation to ensure their accuracy and reliability. This step is crucial for assessing how the model will perform on unseen data.
Deployment: Once validated, predictive models are deployed within business processes or decision-making tools to provide real-time predictions and insights.
Prescriptive analytics represents the cutting edge of business analytics, offering not just insights or forecasts but actionable recommendations designed to guide decision-making toward optimal outcomes.
It synthesizes information from descriptive and predictive analytics to suggest specific actions and consider the implications of each decision option. By employing advanced techniques like optimization, simulation, and machine learning, prescriptive analytics helps businesses not only to anticipate future trends but also to shape them.
Prescriptive analytics uses a combination of data, mathematical models, and computational algorithms to recommend actions. It often involves the following steps and components:
Data Collection: Gathering and integrating data from various sources, including historical data, transactional data, real-time data feeds, and big data.
Predictive Models: Building on predictive analytics to forecast future scenarios based on the data collected.
Decision Variables: Identifying and defining the variables that decision-makers can control.
Constraints: Recognizing any limitations or restrictions that might impact decision-making (e.g., budgetary, regulatory, capacity constraints).
Optimization Algorithms: Using mathematical optimization to find the best outcome from a set of potential outcomes, based on the objectives and constraints defined.
Simulation: Employing simulation models to explore the potential outcomes of different decision paths in a risk-free environment. This can include stochastic modeling to account for uncertainty and variability in predictions.
Machine Learning: Leveraging machine learning algorithms to improve the accuracy of predictions and the efficacy of recommendations over time, adapting to new data and outcomes.
Prescriptive analytics finds applications across various industries, optimizing decision-making processes and enhancing operational efficiency. Some notable applications include:
Prescriptive analytics can optimize supply chain operations by determining the most efficient inventory levels, production schedules, and distribution paths. It can suggest adjustments to minimize costs, meet delivery times, and respond to changing market demands or disruptions in the supply chain.
In banking and finance, prescriptive analytics helps in portfolio management by suggesting investment strategies that maximize returns while mitigating risks. It can also guide credit risk management by recommending credit limits and loan conditions tailored to individual customer profiles.
Prescriptive analytics aids healthcare providers in improving patient care through personalized treatment plans and preventive care recommendations. It can also optimize resource allocation, such as staffing levels and equipment utilization, to improve service delivery and reduce costs.
For utilities and energy companies, prescriptive analytics can forecast energy demand and recommend the most efficient energy production and distribution strategies. This includes optimizing the mix of energy sources, scheduling maintenance to avoid disruptions, and improving energy trading decisions.
Cognitive analytics is an advanced area of analytics that seeks to mimic human reasoning and thought processes in a computerized model. It leverages technologies such as artificial intelligence (AI), machine learning, natural language processing (NLP), and data mining to analyze large volumes of data in a way that mimics human understanding and insight. This approach allows businesses to process and interpret unstructured data, such as text, images, and voice, in a sophisticated manner that traditional analytics methods cannot achieve. Cognitive analytics systems learn and evolve based on the information they process, continually improving and providing deeper insights over time.
The applications of cognitive analytics are diverse and impactful across various sectors:
Statistical learning is a framework for understanding and modeling the relationships between variables using statistical methods. It forms the foundation for many predictive and inferential techniques used in data science and machine learning.
Definition: Statistical learning is the process of using statistical models to estimate the underlying structure in data.
Objective:
Types of Statistical Learning:
Machine learning builds upon statistical learning and focuses on creating algorithms that learn patterns from data and make predictions or decisions without being explicitly programmed.
Machine learning involves designing and training models that enable systems to improve performance as they are exposed to more data.
Types of Machine Learning:
| Aspect | Statistical Learning | Machine Learning |
|---|---|---|
| Focus | Inference | Prediction |
| Data Size | Small to medium datasets | Large and complex datasets |
| Techniques | Parametric and non-parametric | Neural networks, deep learning |
| Application | Traditional analytics | Automation and AI |
Artificial Intelligence (AI) is revolutionizing the agriculture sector by enabling smarter and more efficient farming practices. In agribusiness, AI refers to the application of intelligent systems to optimize agricultural processes, improve decision-making, and address challenges such as food security and sustainability.
AI involves creating intelligent systems capable of analyzing data, learning from it, and making decisions to optimize agribusiness operations.
Types of AI:
Increased Efficiency: AI optimizes resource use, reducing costs and environmental impact.
Enhanced Productivity: Enables data-driven decisions, resulting in higher yields.
Sustainability: Promotes eco-friendly farming practices through precision agriculture.
Risk Mitigation: AI forecasts market trends and weather, reducing uncertainties for farmers.
Data Limitations: Insufficient data from small-scale farmers hinders AI model training.
Cost of Implementation: High costs of AI technologies can be a barrier for smallholder farmers.
Infrastructure Issues: Limited access to the internet and electricity in rural areas poses challenges.
Ethical Concerns: Privacy issues related to data collection and use.
Artificial Intelligence is set to transform agribusiness by: - Enhancing food production to meet the demands of a growing population. - Promoting sustainable farming practices to combat climate change. - Revolutionizing the supply chain to minimize food loss and maximize efficiency.
Data mining is a critical process in agribusiness, enabling the extraction of valuable insights from large datasets. It involves analyzing structured and unstructured data to uncover patterns, relationships, and trends that can drive informed decision-making in agriculture.
Data mining refers to the process of discovering meaningful patterns, correlations, and anomalies in large datasets using statistical and computational methods.
Core Techniques:
Enhanced Decision-Making: Data mining provides actionable insights, enabling farmers and agribusiness managers to make informed decisions.
Increased Efficiency: Optimizes resource allocation, reducing costs and environmental impact.
Risk Mitigation: Identifies potential risks, such as pest infestations or market downturns, allowing for proactive measures.
Improved Productivity: Enhances crop and livestock yields through data-driven strategies.
Data Quality: Inconsistent or incomplete data can affect the accuracy of results.
Data Access: Limited access to data in rural areas can be a barrier to effective data mining.
Technical Expertise: Requires skilled personnel to analyze and interpret data mining outputs.
Infrastructure Constraints: Inadequate technology and internet access can hinder data mining processes.
As data availability and computational power grow, data mining will play an increasingly vital role in: - Developing precision agriculture practices. - Addressing global food security challenges. - Enhancing sustainability in farming. - Driving innovation in agribusiness decision-making.
Data mining, when integrated with advanced technologies like artificial intelligence and machine learning, holds the potential to transform the agricultural landscape.
The terms analysis and analytics are often used interchangeably, but they have distinct meanings, especially in the context of data-driven decision-making. Understanding the difference between the two is crucial for effectively leveraging data to achieve business goals.
| Aspect | Analysis | Analytics |
|---|---|---|
| Focus | Understanding and summarizing past events. | Generating insights and predictions for future decisions. |
| Approach | Descriptive and diagnostic. | Predictive and prescriptive. |
| Scope | Narrow: Focused on specific problems or datasets. | Broader: Encompasses tools, methods, and processes. |
| Techniques Used | Statistical summaries, charts, graphs. | Machine learning, statistical modeling, simulations. |
| Tools | Basic tools like Excel, descriptive statistics. | Advanced tools like R, Python, Tableau, Power BI. |
| Objective | To explain or describe data. | To derive actionable insights and make predictions. |
| Time Orientation | Primarily past-oriented. | Focused on both past and future. |
Business intelligence (BI) and business analytics (BA) are two essential components of modern data-driven organizations. While they share similarities in using data to support decision-making, their focus, purpose, and methodologies differ.
| Aspect | Business Intelligence (BI) | Business Analytics (BA) |
|---|---|---|
| Focus | Reporting and monitoring past and current data. | Analyzing data to predict and influence future outcomes. |
| Purpose | Provides a descriptive and diagnostic view. | Offers predictive and prescriptive insights. |
| Time Orientation | Historical and real-time data analysis. | Future-oriented analysis and decision-making. |
| Tools | Dashboards, scorecards, OLAP (Online Analytical Processing). | Predictive models, statistical analysis, and machine learning tools. |
| Techniques | Data aggregation, visualization, and reporting. | Statistical modeling, data mining, and simulations. |
| Use Cases | Monitoring key performance indicators (KPIs). | Developing strategies based on predictive trends. |
| Complexity | Less complex, focuses on straightforward data analysis. | More complex, involves advanced analytics and modeling. |
While both BI and BA are integral to data-driven decision-making, their roles complement each other. BI focuses on monitoring and understanding past performance, while BA emphasizes predicting and shaping the future. Together, they empower businesses to make informed, strategic decisions.
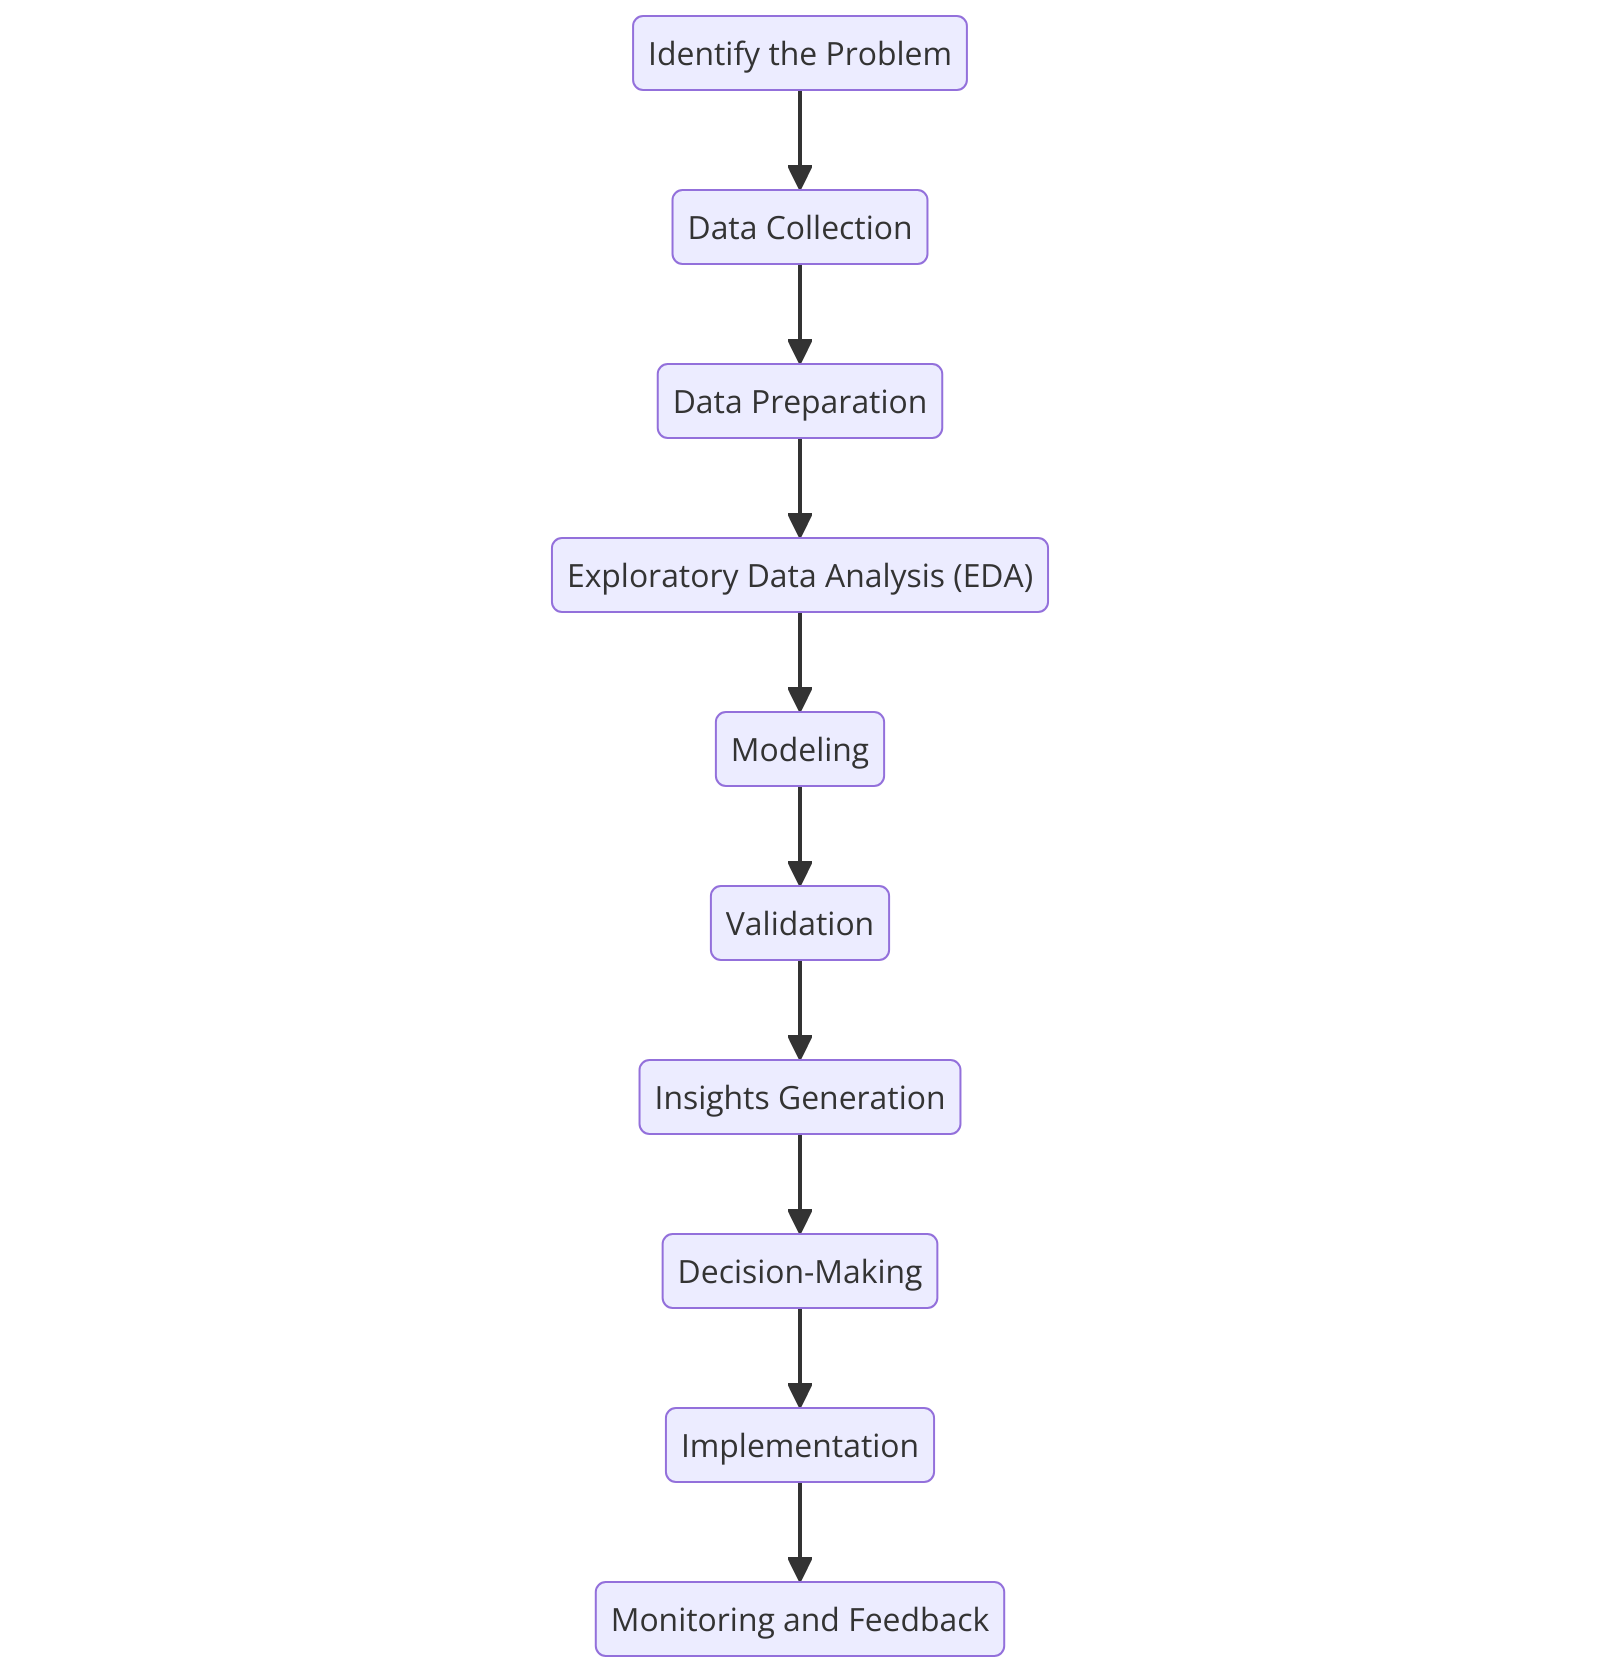
The business analytics cycle represents a structured approach to solving business problems through data-driven decision-making. It involves systematically gathering, processing, analyzing, and utilizing data to uncover insights that support informed actions.
| Concept | Description |
|---|---|
| **Algorithm** | |
| Key Characteristics of an Algorithm: | Finite Steps**: Algorithms must have a clear beginning and end |
| Types of Algorithms in Analytics and Machine Learning | Sorting and Searching Algorithms** These algorithms organize and retrieve data efficiently |
| Importance of Algorithms in Machine Learning | Foundation for Learning Models**: Algorithms train machine learning models to recognize patterns and make predictions |
| Examples of Algorithm Application in Real-World Scenarios | Agribusiness**: Algorithm**: K-Means Clustering |
| Example: Machine Learning Algorithm (Linear Regression) | Algorithm Explanation: Linear regression finds the relationship between an independent variable X and a dependent variable Y by fitting a line that minimizes |
| **Big Data** | |
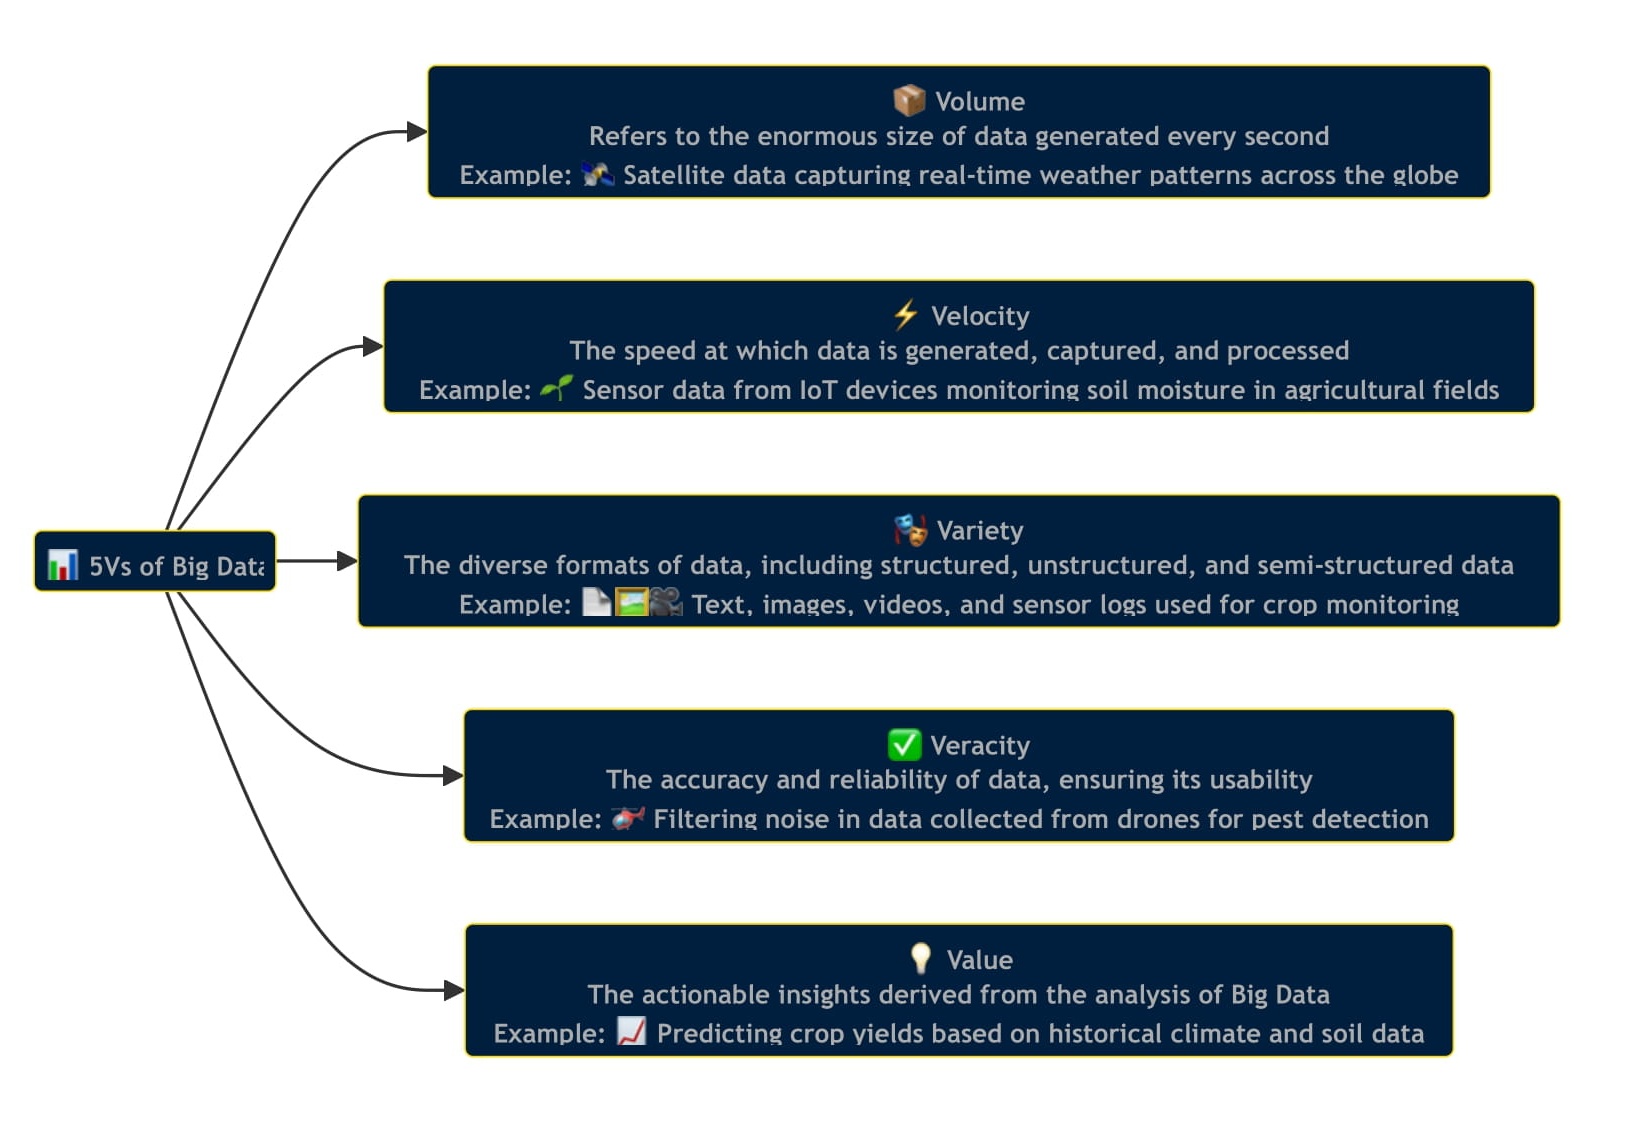
| Characteristics of Big Data (The 5 Vs) | Volume**: Refers to the enormous size of data generated every second |
| Applications of Big Data in Machine Learning | Training Models**: Big Data serves as the fuel for training machine learning models, improving their accuracy and reliability |
| Tools and Technologies for Big Data | Storage and Management**: Hadoop**: A distributed storage and processing system for large datasets |
| Examples of Big Data Applications | Agribusiness**: Use Case**: Monitoring crop health using data from satellites, drones, and IoT sensors |
| **Business Analytics** | |
| Data Analytics and components | Data Analytics** is the process of examining, cleaning, transforming, and modeling data with the objective of discovering useful information, informing |
| Data Analytics Tools and Technologies | Key concept under **Business Analytics** |
| Types of Business Analytics | Business analytics can be divided into several types, each addressing different kinds of decision-making needs and business processes |
| Descriptive Analytics | Descriptive analytics is the examination of historical data to understand changes that have occurred in a business |
| Diagnostic Analytics | Diagnostic analytics takes a step further from descriptive analytics by not just describing what has happened in the past, but also attempting to understand |
| Predictive Analytics | Predictive analytics encompasses a suite of statistical techniques and models that analyze historical and current data to make predictions about future events |
| Prescriptive Analytics | Prescriptive analytics represents the cutting edge of business analytics, offering not just insights or forecasts but actionable recommendations designed to |
| Cognitive Analytics | Cognitive analytics is an advanced area of analytics that seeks to mimic human reasoning and thought processes in a computerized model |
| **Statistical Learning** | |
| Key Concepts in Statistical Learning | Definition:** Statistical learning is the process of using statistical models to estimate the underlying structure in data |
| Applications of Statistical Learning | Agribusiness:** Predicting crop yields based on soil and weather conditions |
| Common Techniques in Statistical Learning | Regression Analysis:** Linear regression, logistic regression, polynomial regression |
| **Machine Learning** | |
| Key Concepts in Machine Learning | Machine learning involves designing and training models that enable systems to improve performance as they are exposed to more data |
| Applications of Machine Learning | Agribusiness:** Automated pest detection using image recognition |
| Common Machine Learning Algorithms | Regression: Linear, logistic |
| Statistical Learning vs. Machine Learning | | Aspect | Statistical Learning | Machine Learning | |
| **Artificial Intelligence** | |
| Key Concepts in Artificial Intelligence | AI involves creating intelligent systems capable of analyzing data, learning from it, and making decisions to optimize agribusiness operations |
| Applications of Artificial Intelligence in Agribusiness | Precision Farming:** AI systems analyze soil health and recommend precise amounts of fertilizers and pesticides |
| Benefits of Artificial Intelligence in Agribusiness | Increased Efficiency:** AI optimizes resource use, reducing costs and environmental impact |
| Challenges in Applying AI to Agribusiness | Data Limitations:** Insufficient data from small-scale farmers hinders AI model training |
| The Future of AI in Agribusiness | Artificial Intelligence is set to transform agribusiness by: Enhancing food production to meet the demands of a growing population |
| **Data Mining** | |
| Key Concepts in Data Mining | Data mining refers to the process of discovering meaningful patterns, correlations, and anomalies in large datasets using statistical and computational methods |
| Applications of Data Mining in Agribusiness | Crop Management:** Analyzing historical and real-time data to recommend planting schedules and irrigation practices |
| Benefits of Data Mining in Agribusiness | Enhanced Decision-Making:** Data mining provides actionable insights, enabling farmers and agribusiness managers to make informed decisions |
| Challenges in Data Mining for Agribusiness | Data Quality:** Inconsistent or incomplete data can affect the accuracy of results |
| The Future of Data Mining in Agribusiness | As data availability and computational power grow, data mining will play an increasingly vital role in |
| **Difference Between Analysis and Analytics** | |
| Definition | Analysis**: Refers to the detailed examination or study of data to identify patterns, relationships, and insights |
| Key Differences | | Aspect | Analysis | Analytics | |
| Examples | Agribusiness: Analysis: Studying historical rainfall data to understand its correlation with crop yield |
| Interconnection | Analysis serves as the foundation for analytics |
| Importance of Differentiating the Two | Strategy Development: Businesses can use analysis to understand their past performance and analytics to create future strategies |
| **Difference Between Business Intelligence and Business Analytics** | |
| Definition | Business Intelligence (BI)**: Refers to the technologies, processes, and practices used to collect, integrate, and analyze historical data to support business |
| Key Differences | | Aspect | Business Intelligence (BI) | Business Analytics (BA) | |
| Examples | Agribusiness**: BI: Monitoring fertilizer usage and crop yields through dashboards |
| Interconnection Between BI and BA | BI lays the groundwork by providing clean, well-organized data for analysis |
| Importance of Differentiating the Two | Strategic Planning**: BI helps organizations monitor performance, while BA drives future strategies |
| **Typical Process of the Business Analytics Cycle** | |
| Stages of the Business Analytics Cycle | Identify the Problem** Clearly define the business question or problem that needs to be addressed |